
8. Team Dashboard
Beta1 pilot testing version now available for our users to test use.
Beta1 pilot testing version now available for our users to test use.
Athlete’s data: total statistics per session and total in the season in Team Dashboard.

1. Go to Team’s landing page and scroll down to the “Athletes” listings in the bottom of the page.
2. Click on the Athlete’s block you wish to see.
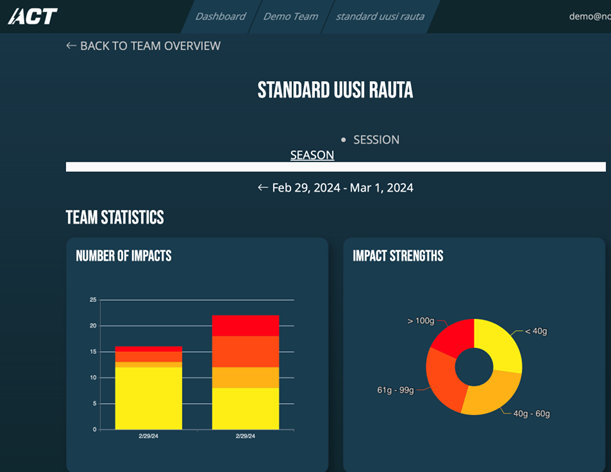
3. Athlete’s landing page opens. It combines this Athlete’s data in the season and sessions. You can navigate here exactly the same way as you do in the Team views. The graphics are the same as with the Team as are the top listings, excluding “most impacts” comparison, which can not be done on an individual Athlete.
What is Team Dashboard?
Team Dashboard is a statistics and light analytics tool for coaches, trainers, teams and clubs. In Team Dashboard you can build teams from the profiles you have or have been shared with you. Team Dashboard can help you to build set of important statistics and key trends on team level, and on each athlete. You can also build top lists of athletes based on selected critical features, and you can manage the data collection of all the profiles to minimize the false positive impacts/events.
Accessing Team Dashboard
Please note: We are developing, improving, updating and making changes to this Beta1 version continuously, so that it would ever better meet your needs and wants. It may be that these instructions are not fully up to date or correct what it comes to the texts or images in it. We apologise the inconvenience this may cause!
Go to www.act-tracker.com website. Scroll down to the bottom of any page.
In Users column you can see “Browser access”. Click on it.
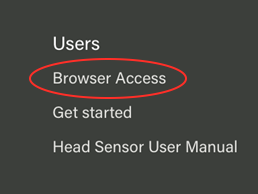
A new window opens with login to Browser Access. You can log in to both Web User Interface and Team Dashboard here.
Log in with your ACT Head Impact Tracker User ID and password, same you have used to create an account in ACT App:
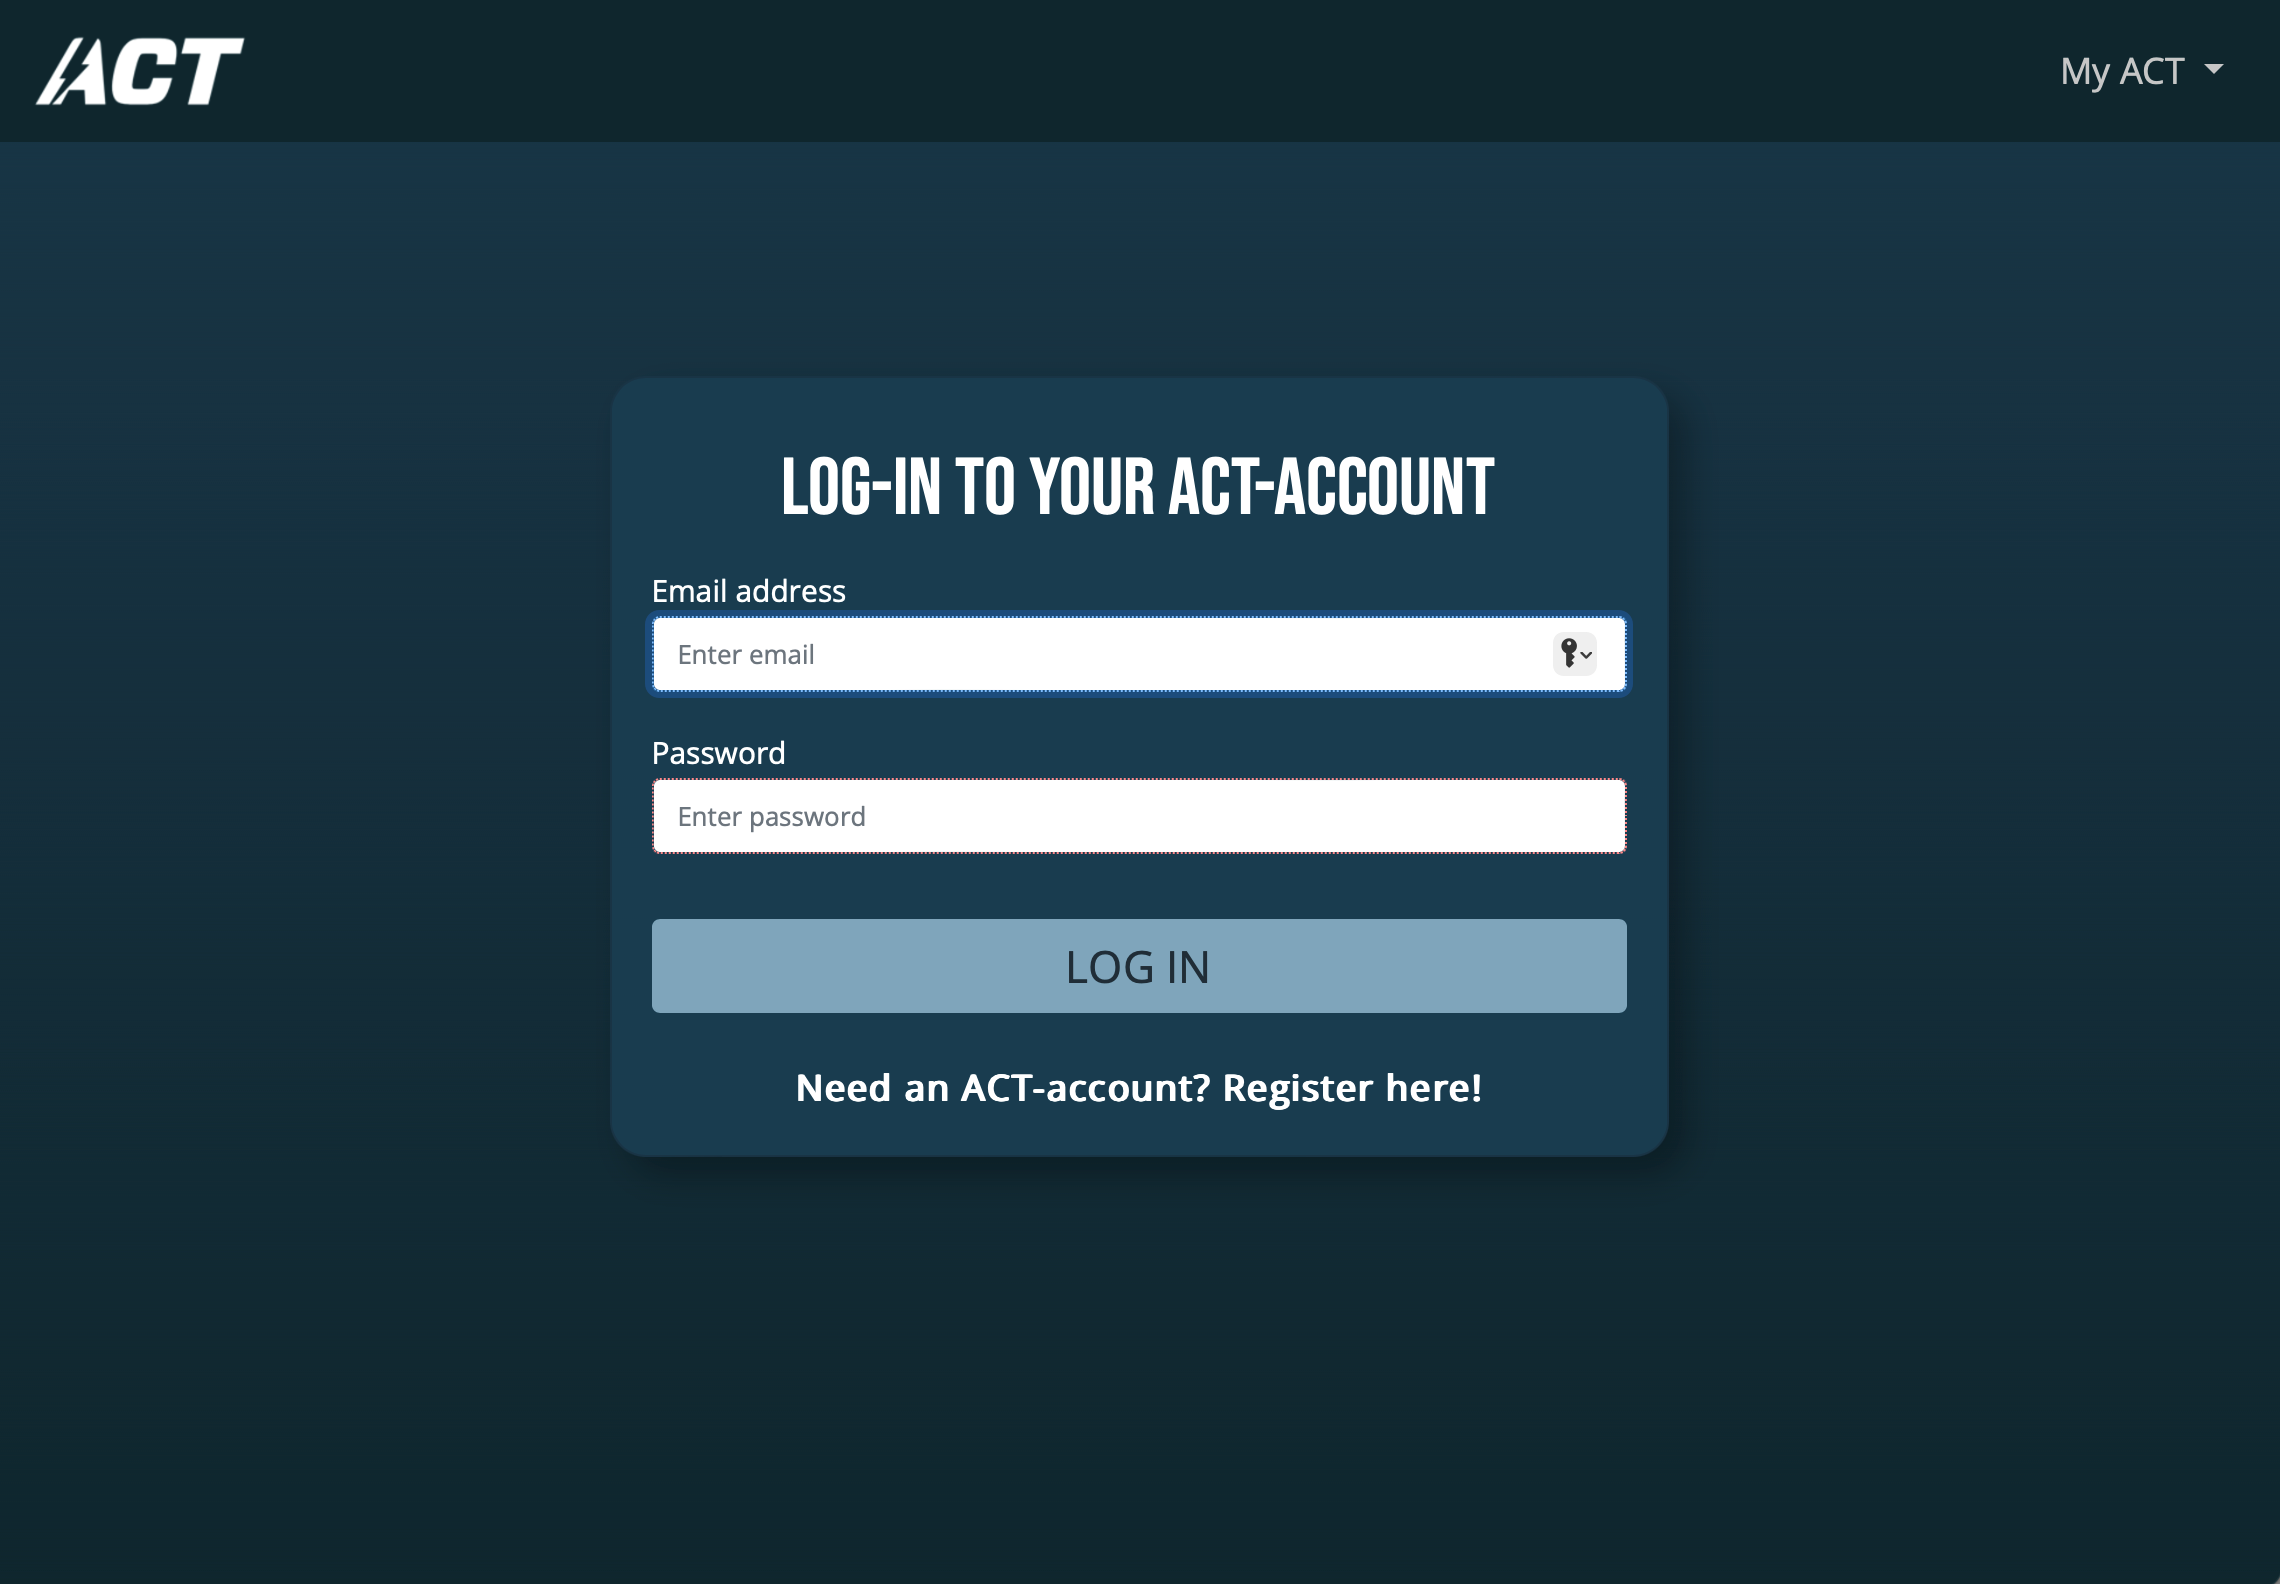
NOTE: you can only log in if you have ACT Head Impact Tracker User Account.
Registering via Browser Access is not functional yet.
To use WebUI, click the profiles on your user account below “Your Profiles” to access detailed event data on each profile
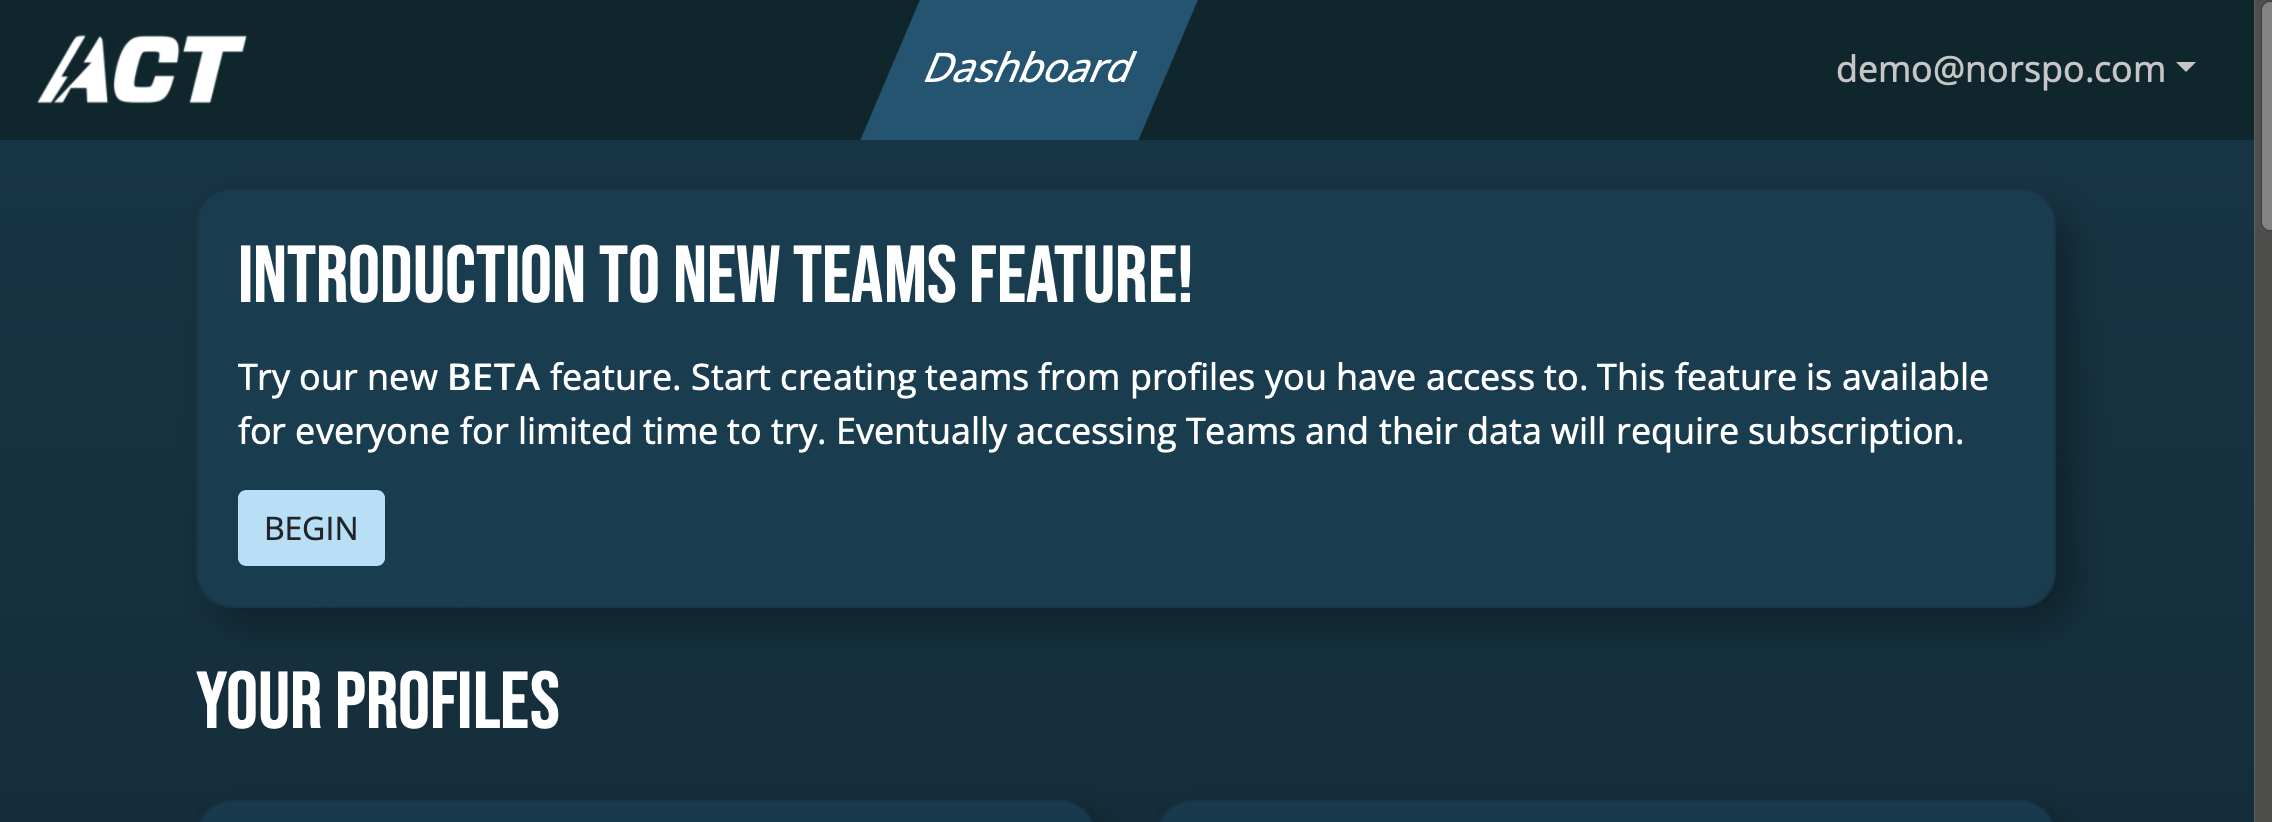
To start using Team Dashboard, create a team in it. In later stages you can access teams created by selecting a team you
wish to see or work on which will become visible and accessible on the top of the site and replace “Introduction to new
team feature” block. Click “Begin” in “Introduction to new team feature”.
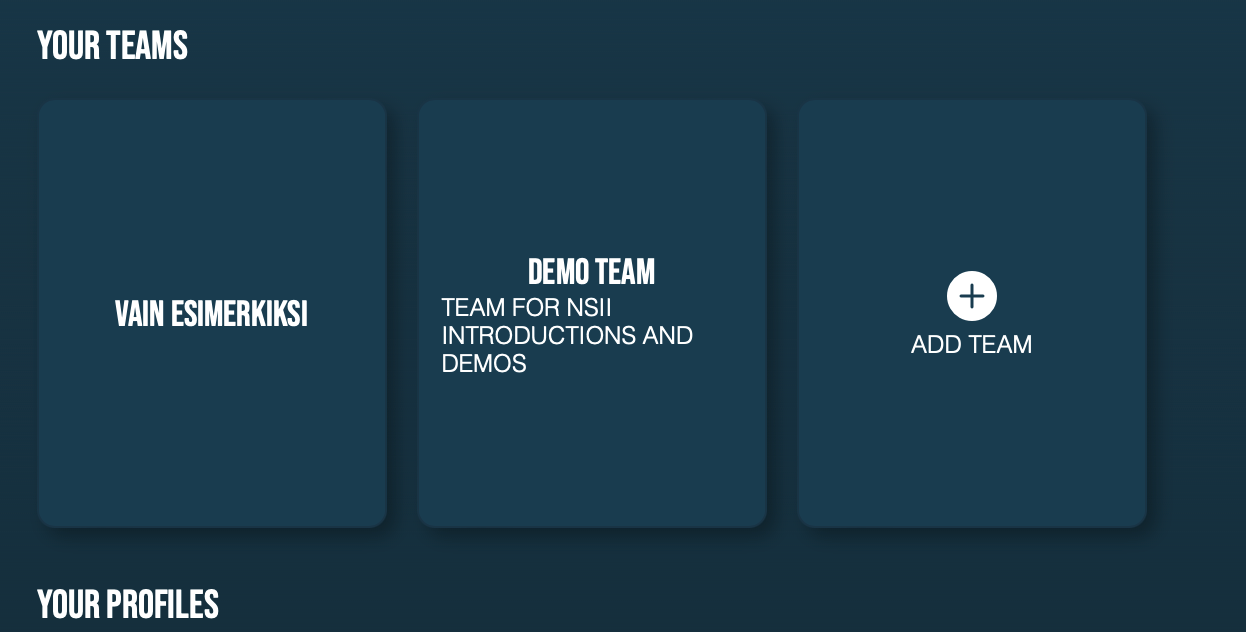
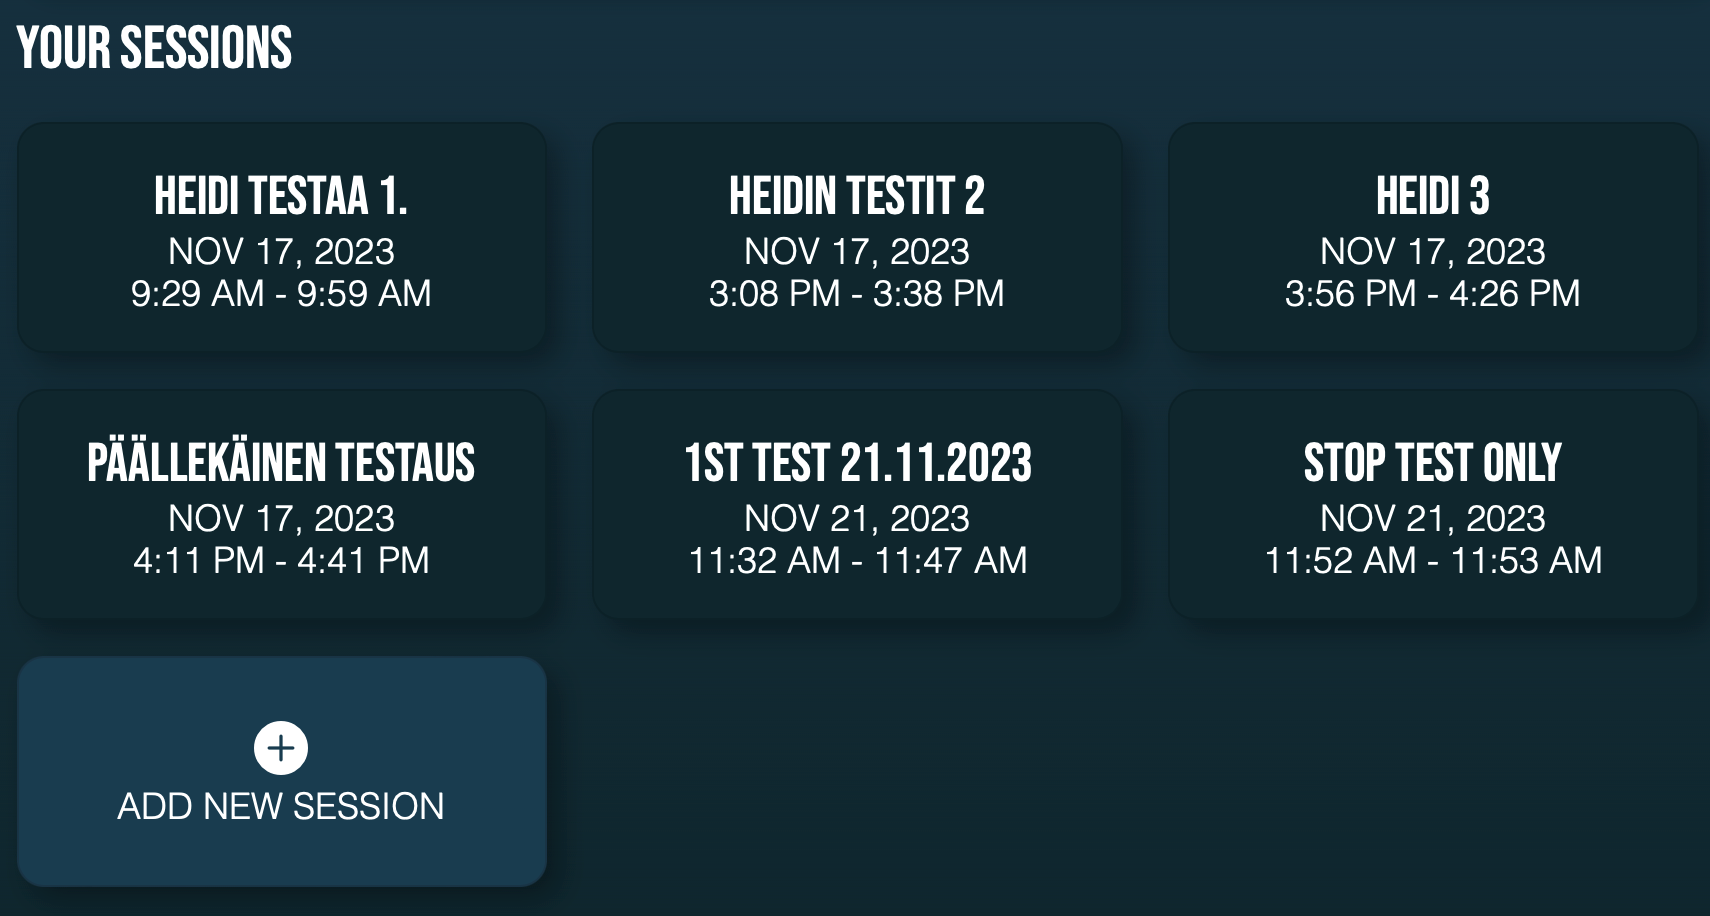
Your teams will feature on top of the Browser Access landing page. Note: The teams are not lined in dynamic order, but in
the order you have created them.
– Click on any team to access Team’s page.
– Create a new team by clicking “Add team”.
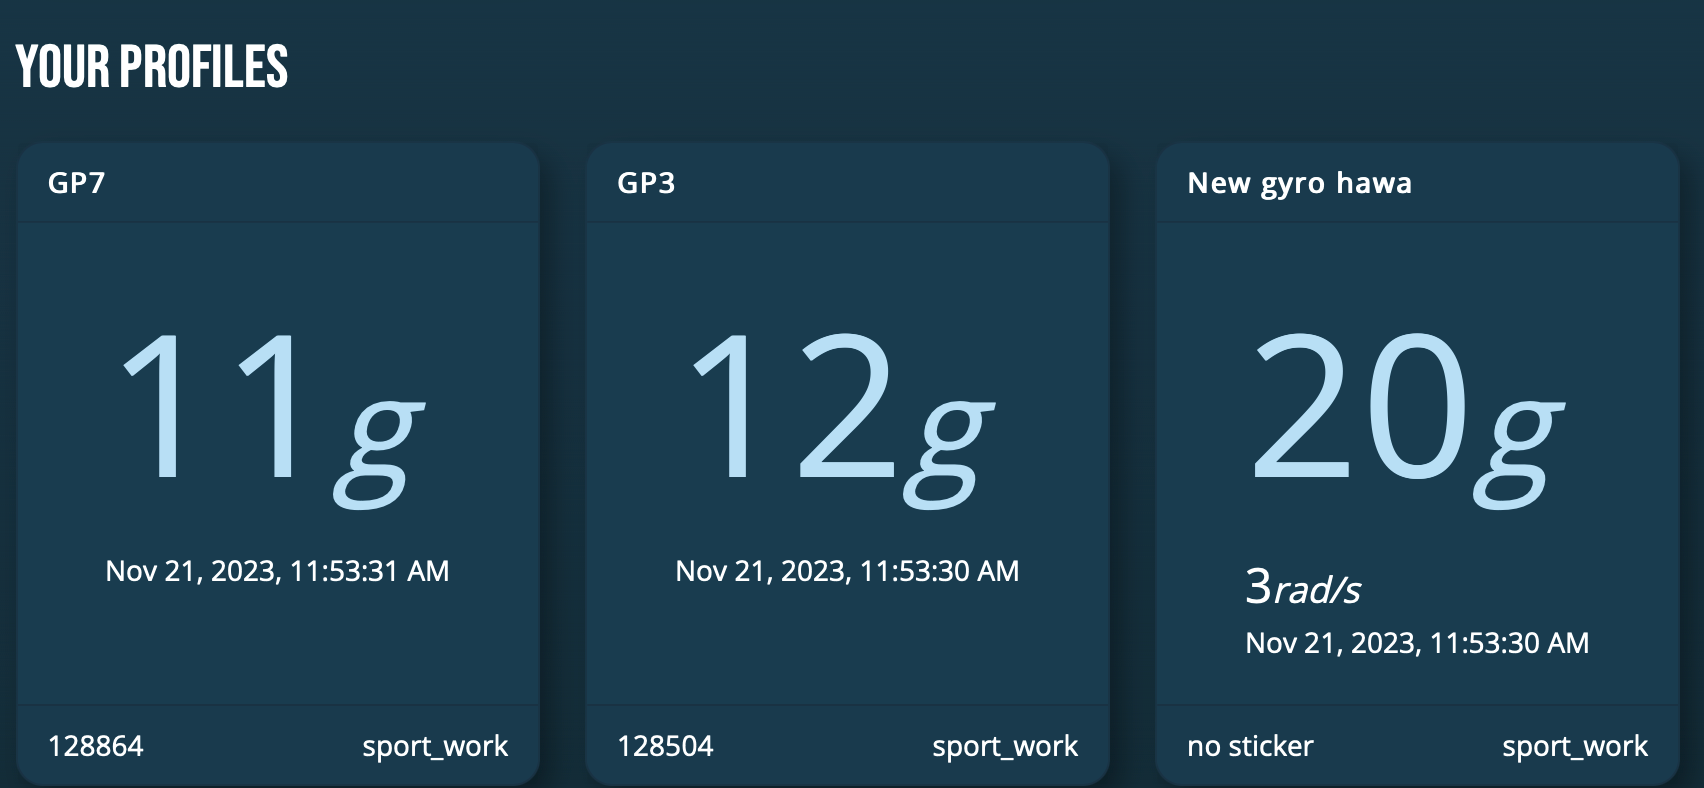
All the Profiles on your User Account, or shared with your user account are visible and accessible in “Your Profiles”. You can
access each profile’s all data by clicking on the profile.
Create and manage the team, seasons and sessions
STEP 1. CREATE A TEAM
– Give the Team a name
– Subtitle: you can give your team a subtitle here.
– Description: you can describe your team here.
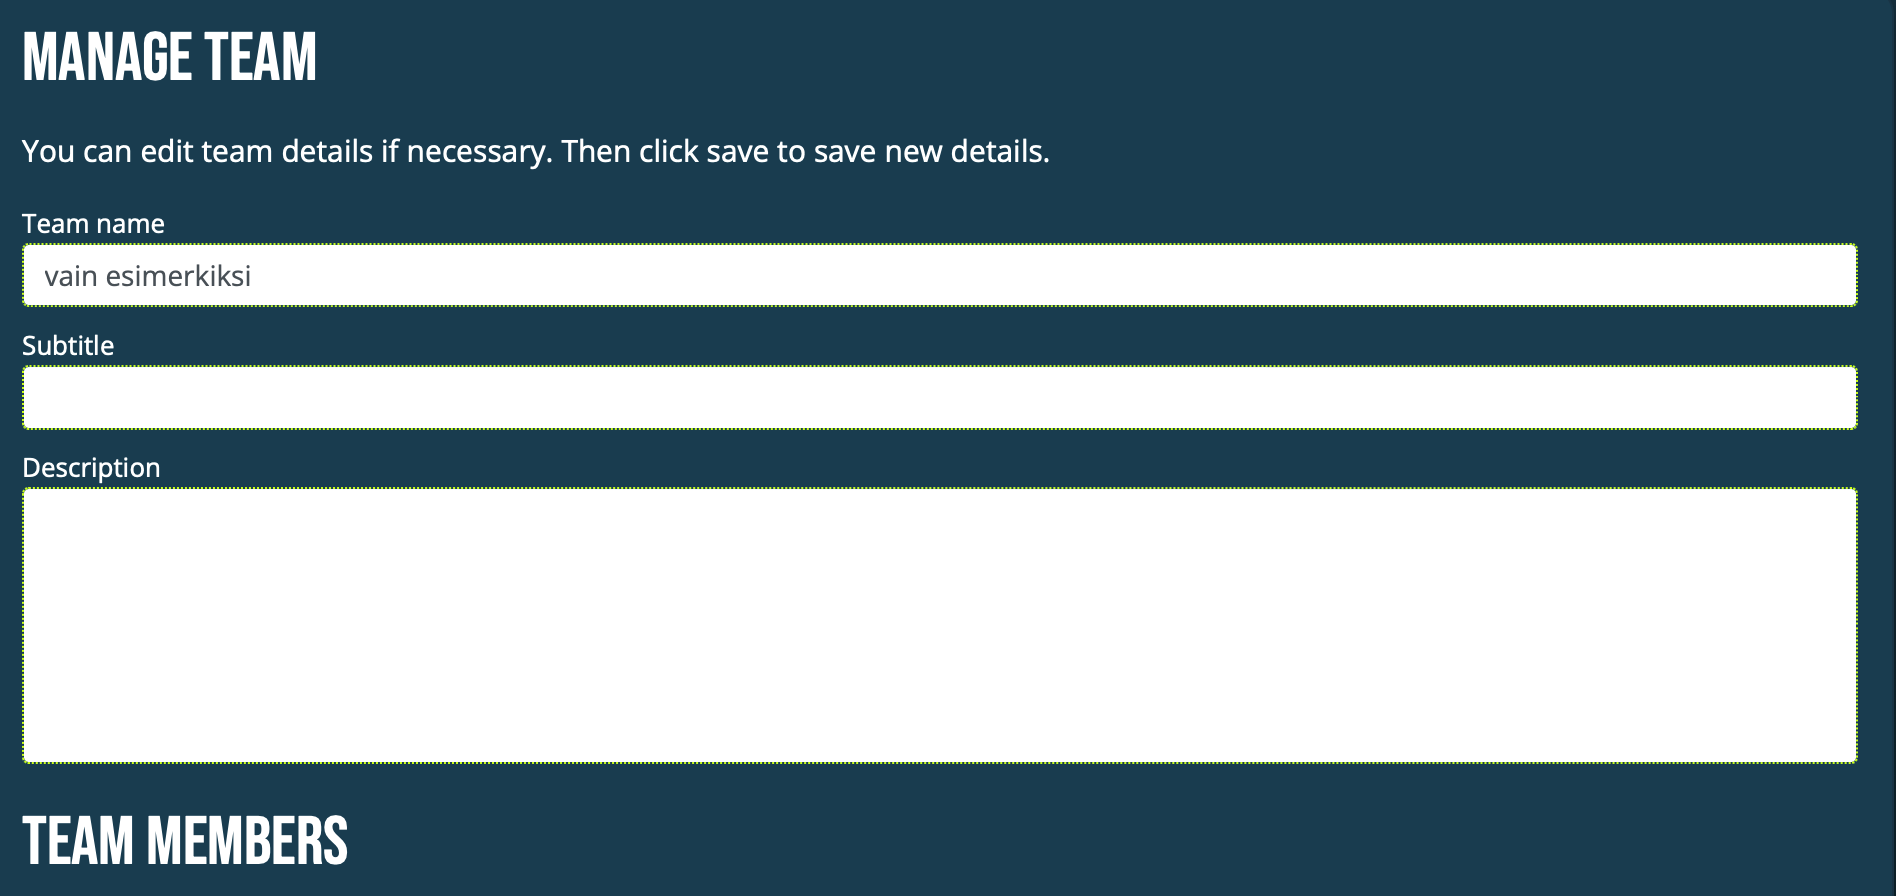
– Team members: Select profiles to formulate the team from the profiles below “Team members”.
– Tick the boxes on the left side of the Profiles’ names you wish to add to the team.
– Click “Create team” to save the Team you have just created.
![]()
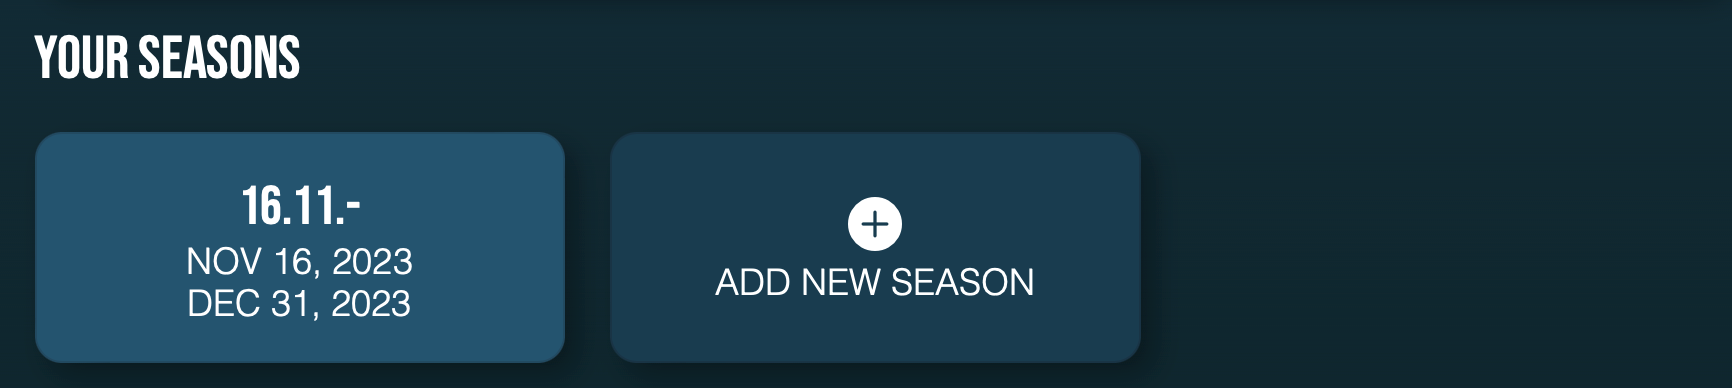
STEP 2: ADD SEASON TO THE TEAM
You must have an ongoing season to add sessions.
1. To Add Season click “Add new season” below “Your seasons”.
2. “Create new seasons” pop up opens
– Give the season a name
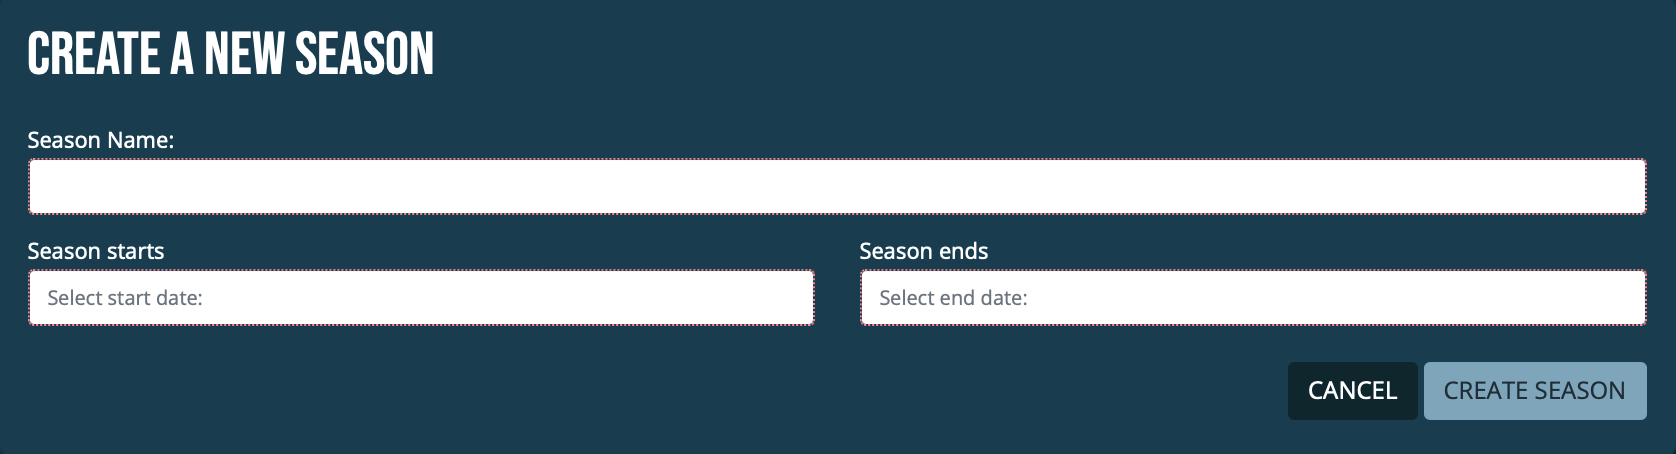
– Click on “season starts” to open a calendar, choose the start date for your season from the calendar.
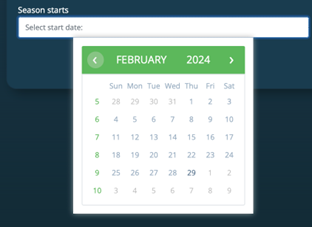
– Click on “Season ends” to open the calendar, choose the end date for your season from the calendar.
– Click on “Create the season” to save the season for your team.
![]()
STEP 3: ADD A SESSION(S) TO YOUR TEAM’S SEASON
You can either quick start a session or add sessions to automatically start later.
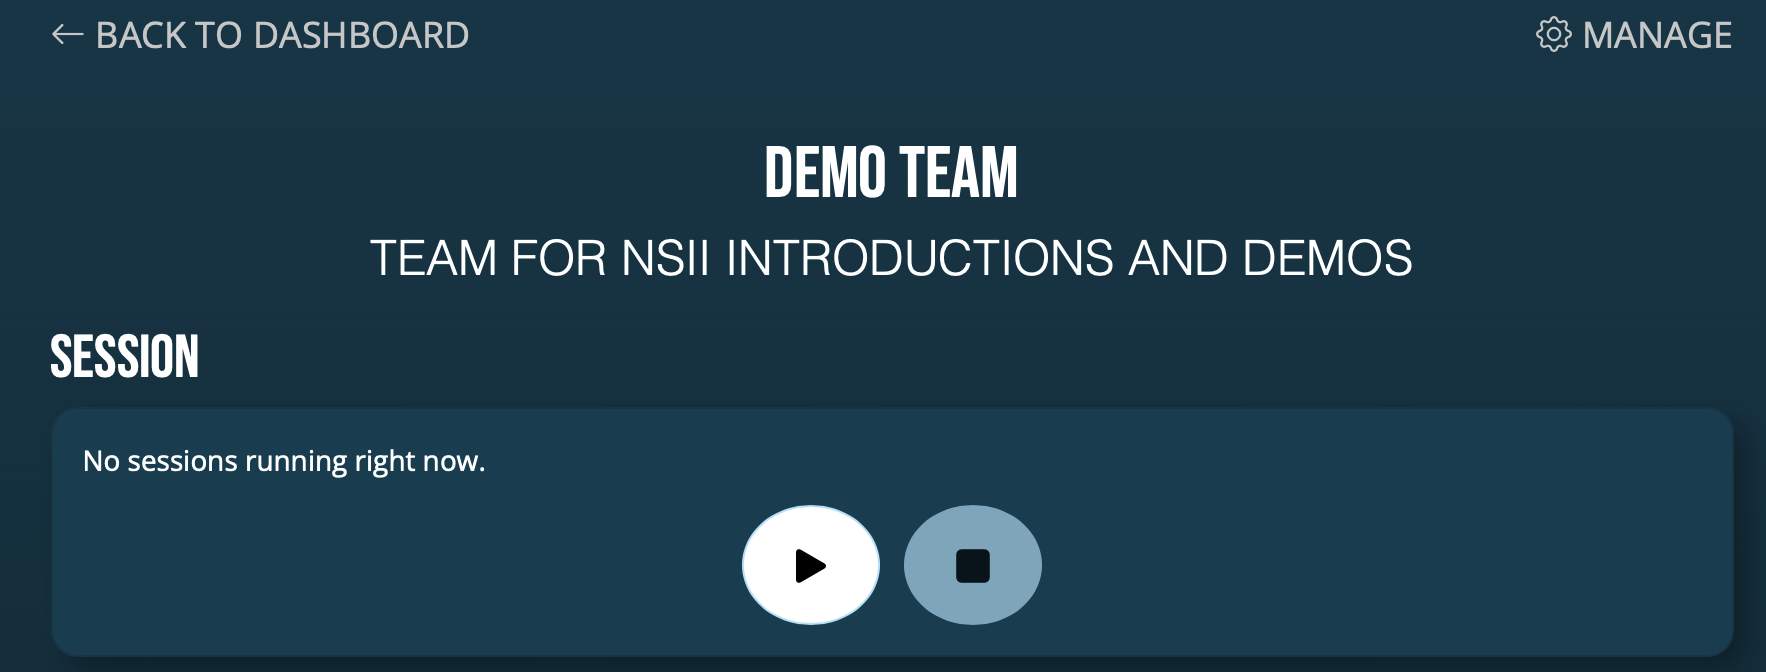
OPTION 1: Quick start a session
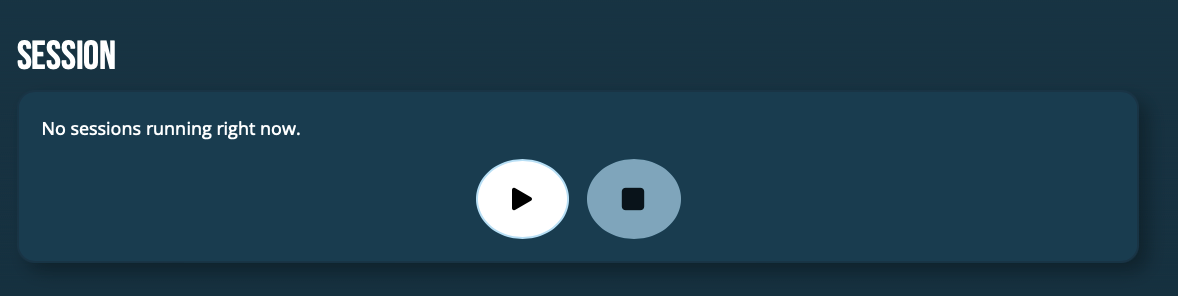
2. To start session “now”, or to schedule session to start soon in 5/10/20 minutes, click play-button on the Team’s landing page.
– A pop-up window opens for the new session details.
– Name the session.
– Select session start time: “now”, in “5 minutes”, in “10 minutes”, or in “20 minutes”.
– Select session end time “30 minutes”, “60 minutes”, “90 minutes” or “120 mins”, 150 mins”, or “180 mins”.
– Save the new session by clicking “Start session”

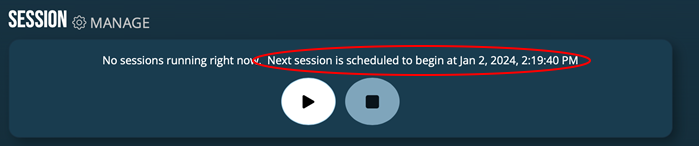
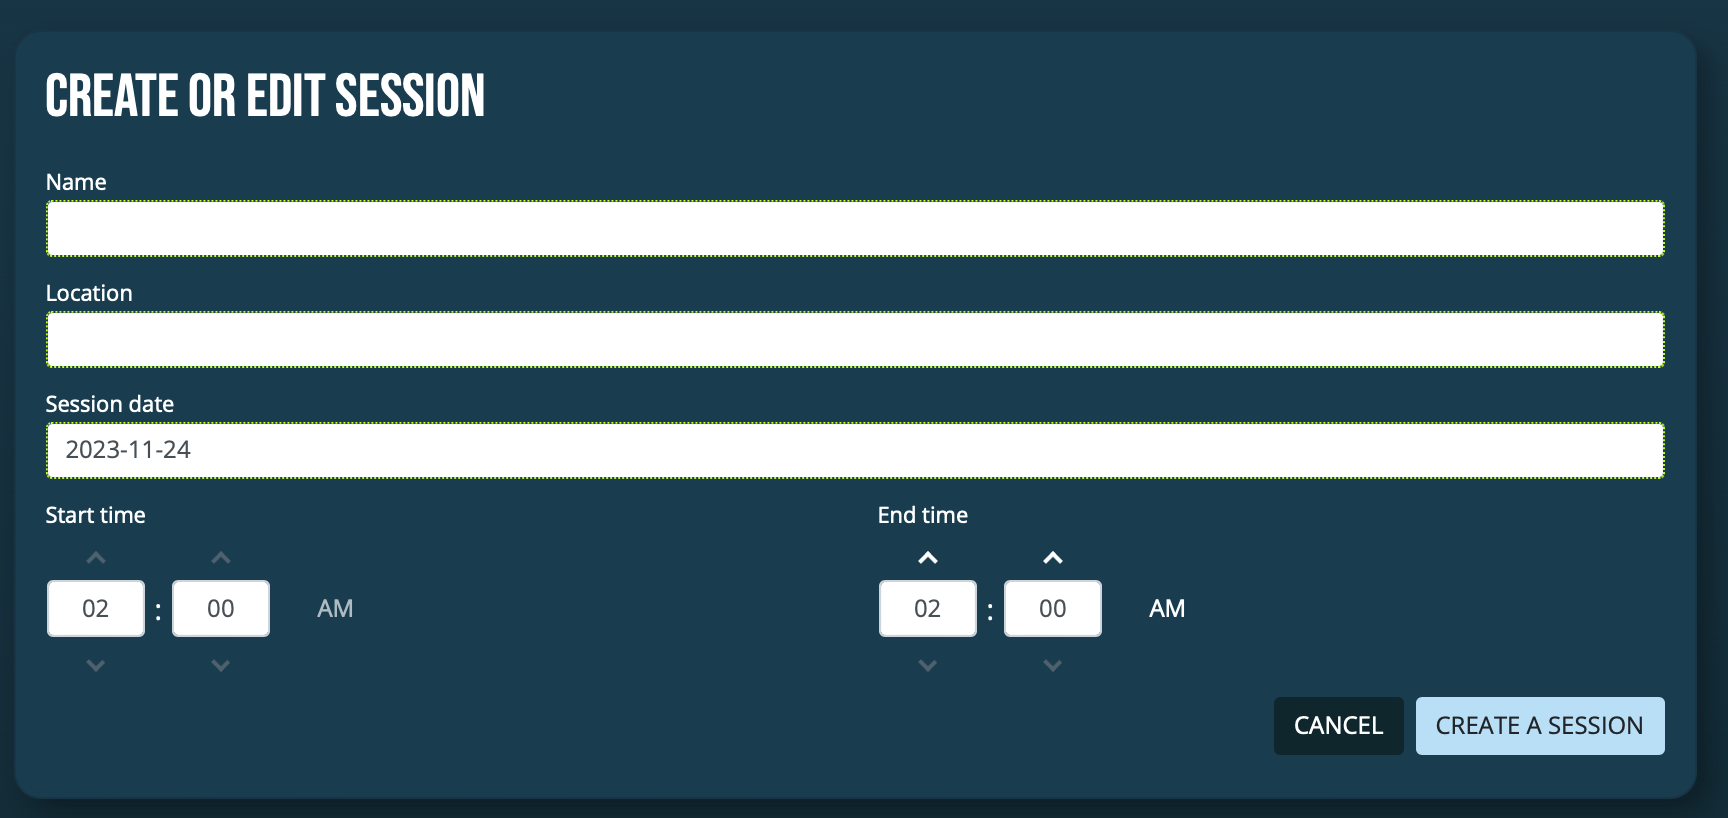
OPTION 2: Add session to automatically start later
– Choose session date by clicking on the white bar which opens a calendar where you can choose the session date.
Set the end time 1st, and only after that set the start time!
– Use arrow heads to choose the right start hour and minutes (you have to choose from the selection given).
Please notice that AM and PM next to the time! AM = 00.00-11.59 (at night and in the morning before midday). PM = 12.00-11.59 = 12.00-23.55 (from midday to midnight)
– Finnish session creation by clicking “Create new session“.
STEP 4. OTHER FUNCTIONS
Edit and manage your existing Team
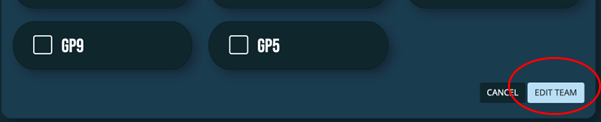
– scroll down to click “Edit team”
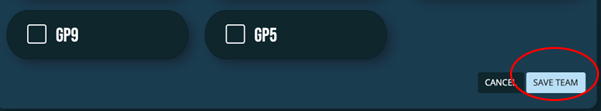
– Make the changes you with to make to the Team’s texts or Player profiles.
– Scroll down and click “Save team” to save the changes you made.
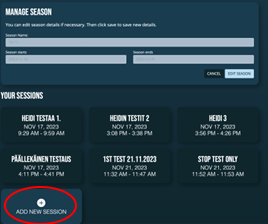
Edit your ongoing season
3. “Manage Season” pop-up window opens.
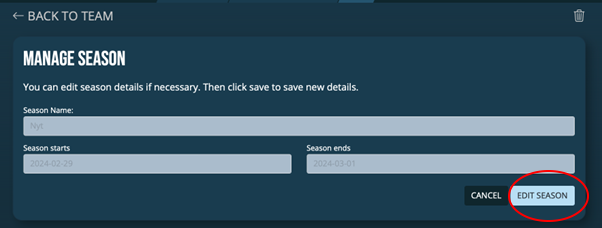
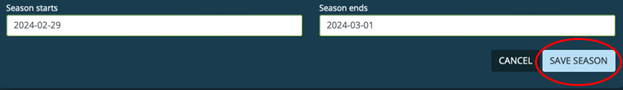
4. Click “Edit season” to change season’s settings. Make the changes you want to make.
5. Click “Save season” to save the changes made.
Create a new season for the Team
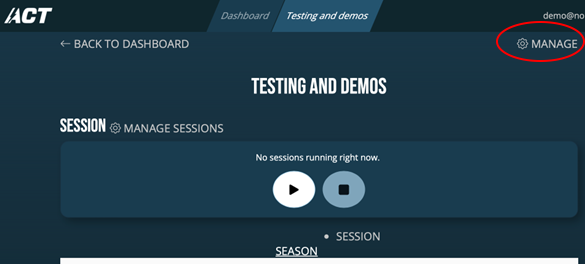
1. Go to Team’s landing page you wish to add new season to.
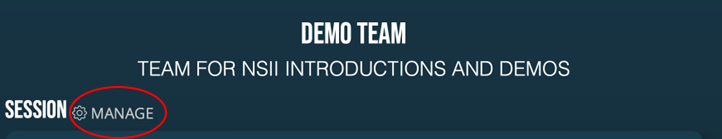
2. Click on “Manage” on the right-hand top corner on Team’s landing page
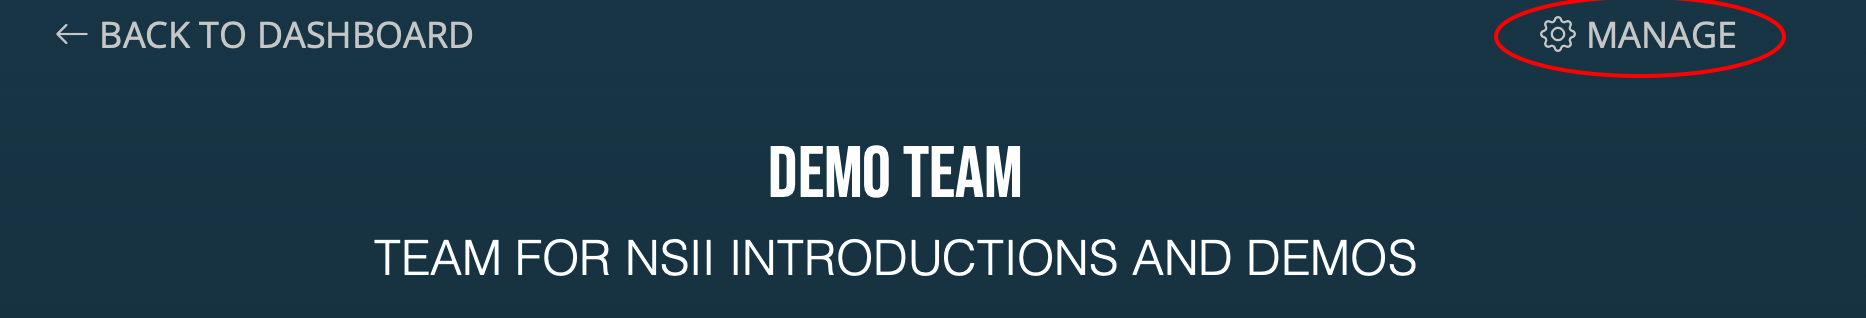
3. Scroll down to the bottom of the page to “Your seasons”, click on “Add new season”
4. Add details to create new season . Finish by clicking “Create new season”
IMPORTANT USAGE INFORMATION!
– Team Dashboard currently only works “from here on”, which means you cannot import past sessions or events, or data from past sessions or events to Team Dashboard.
– Only data from the sessions added and started in Team Dashboard will be included in Team Dashboard statistics and analytics!
– No data outside the sessions added and started in Team Dashboard will be included in Team Dashboard statistics or analytics!
However, no event data will be lost, even if you have not added and started session in Team Dashboard. All the events recorded by the head sensors and forward to the Cloud will be included and featuring in the App and in Web User Interface just like they have always been.
Team’s data. Total team statistics and athlete top lists
Few important points regarding Team data statistics, graphics and top lists.
To refresh the session data (include the latest events to it), refresh the page using your browser’s refresh button.
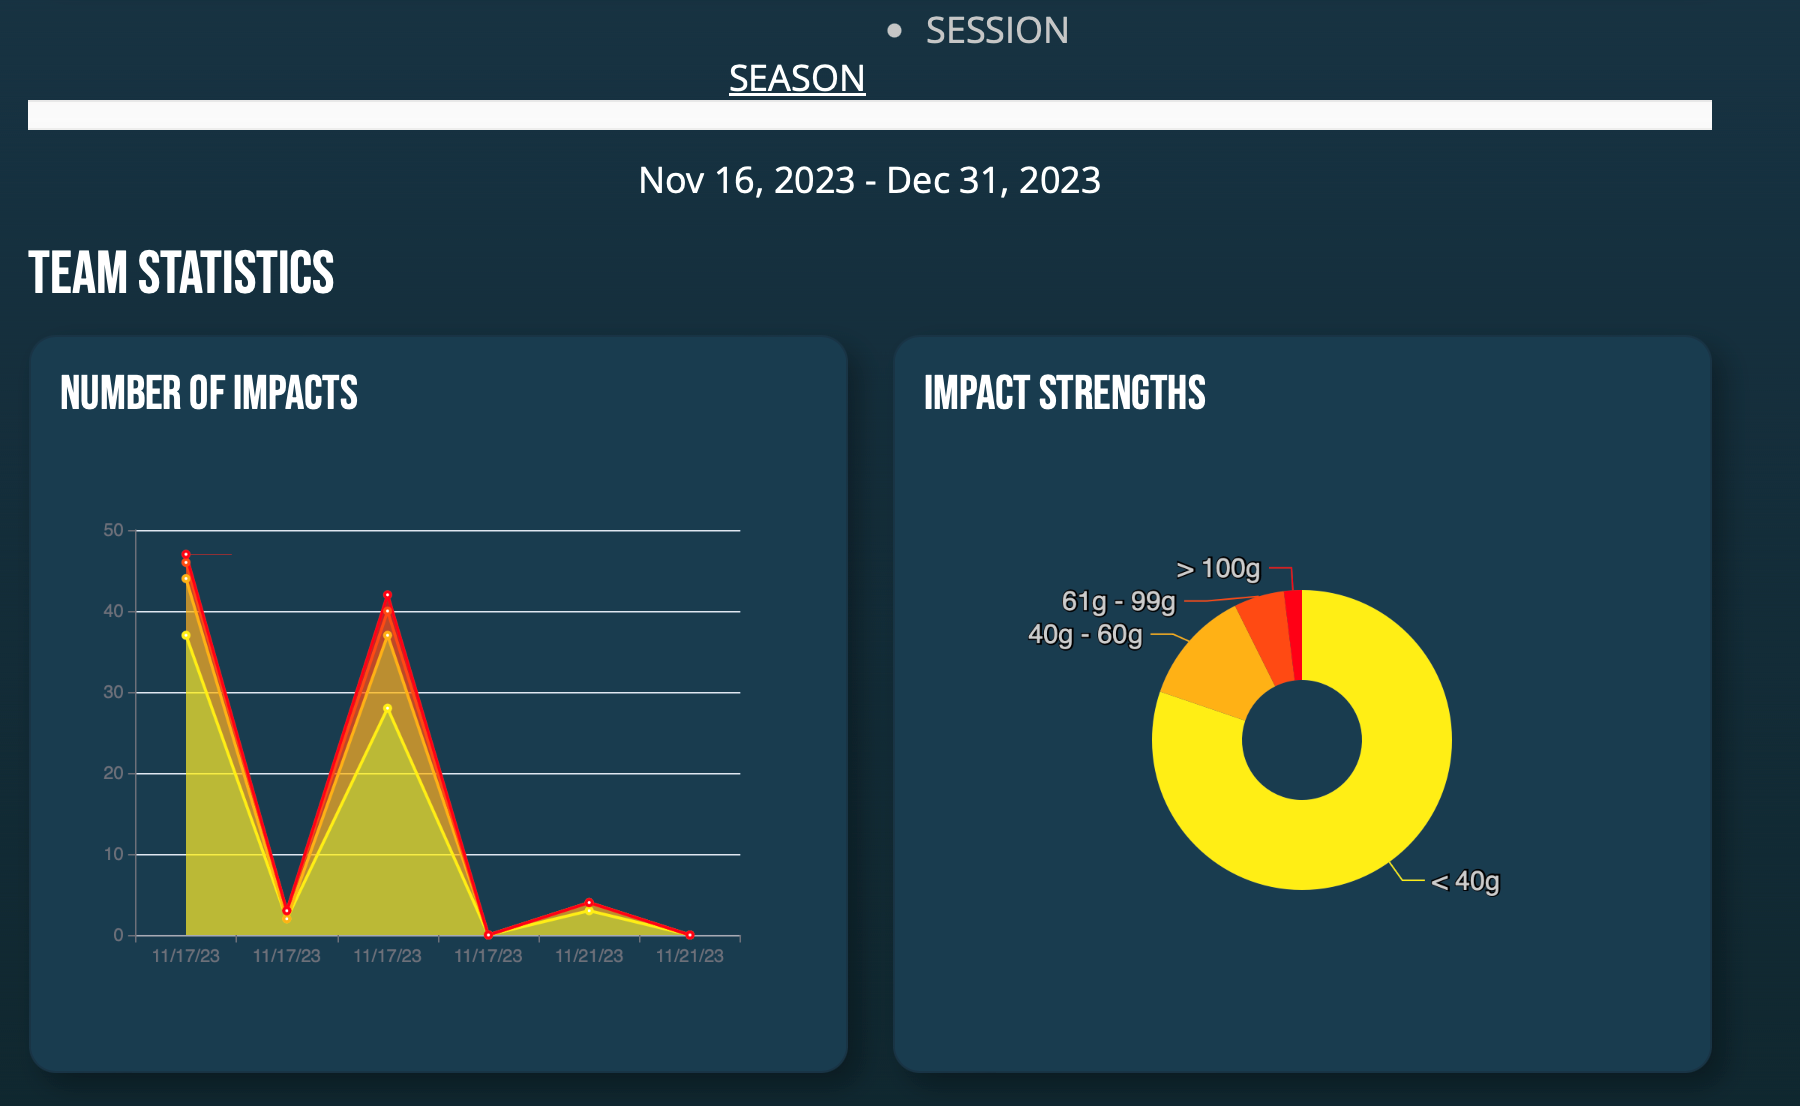
As default the team statistics will feature as SEASON’S accumulated data.
Session or Season
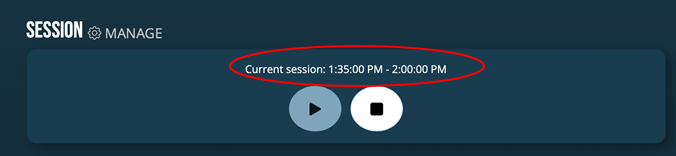
You can look at the statistics and graphics per season = Total events season, and per session = Total events per session. Ongoing season is as default with bright white underlined text. If you wish to change the view to Session (on grey text), click on “Session” text next to “Season” above the 1st white line.

You can browse different seasons and sessions by clicking the arrows next to the season’s information you current have on display. Earlier sessions, click on arrow to the left. Later sessions, click on arrow to the right.
![]()
Team graphical statistics
“Number of impacts”, which is featuring number of 10g or over events on all the athletes in each session. Sessions feature in X-axis. Number of 10g or over events on all the team’s athletes combined per session in on Y-axis.
“Impact Magnitude” (or “impact strength”) is featuring the pie chart divided into 4 magnitude corridors. It displays all 10g or over events of all the athletes in the team per selected season/session. Different colors represent 4 corridors and are as follows:
Yellow color represents the share of events 10-40g.
Orange color represents the share of events with 40-60g.
Red color represents the share of events 61-99g.
Bright red color represents the share of events 100g or over.
IMPORTANT!!! COLORS ARE NOT AN INDICATION OF ANY SORT OF RISK FACTOR! ANY AND ALL IMPACTS ON A HEAD MAY HAVE CONSEQUENCES AND MUST BE PROPERLY ADDRESSED!
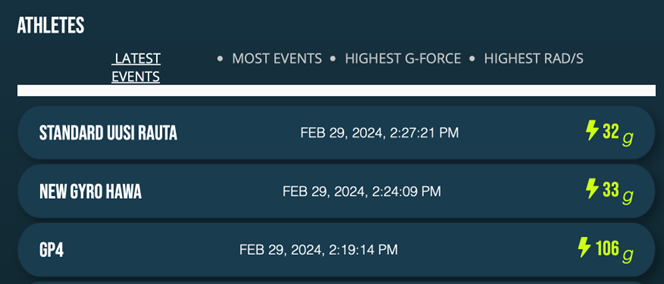
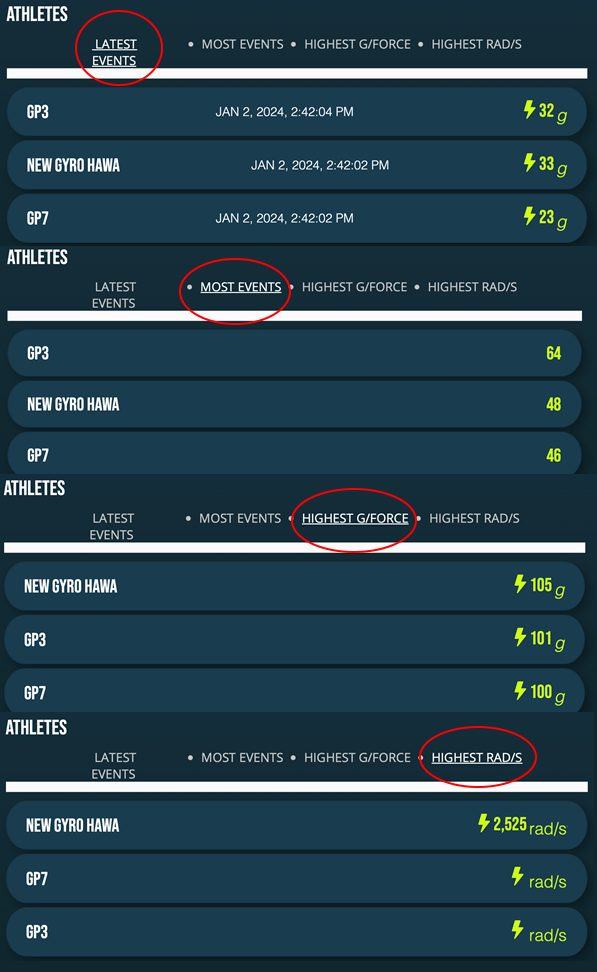
Athlete top lists
All athletes in the team are also ranked in 4 top lists. You can choose which listing you wish to see by clicking on the text just below “Athletes”. The listings are:
“Latest events”: the athlete with latest recorded event is featuring on top of the list. The other athletes below in decending order. Latest impacts is the default listing.
“Most events”: The athlete with most 10g or over events in selected session/season will feature on top of the list, other athletes below in decending order.
“Highest g-force”: The athlete with highest magnitude g-force event in selected session/season will feature on top of the list, other athletes below in decending order.
“Highest rad/s”: The athlete with highest magnitude rad/s event in selected session/season will feature on top of the list, other athletes below in decending order. If the sensor in the profile do not measure angular forces, they are not included nor shown.
COMING SOON: Each Athletes’ total statistics per session and total in the season.
Each athletes’ all individual events and event history = pop into Web User Interface
To see individual athletes’ event history and all individual events (also those not included is a season or a session), add notes to the events, or to mark events as false positives (“faulty”). All this can be seen and done in “Web User Interface”.
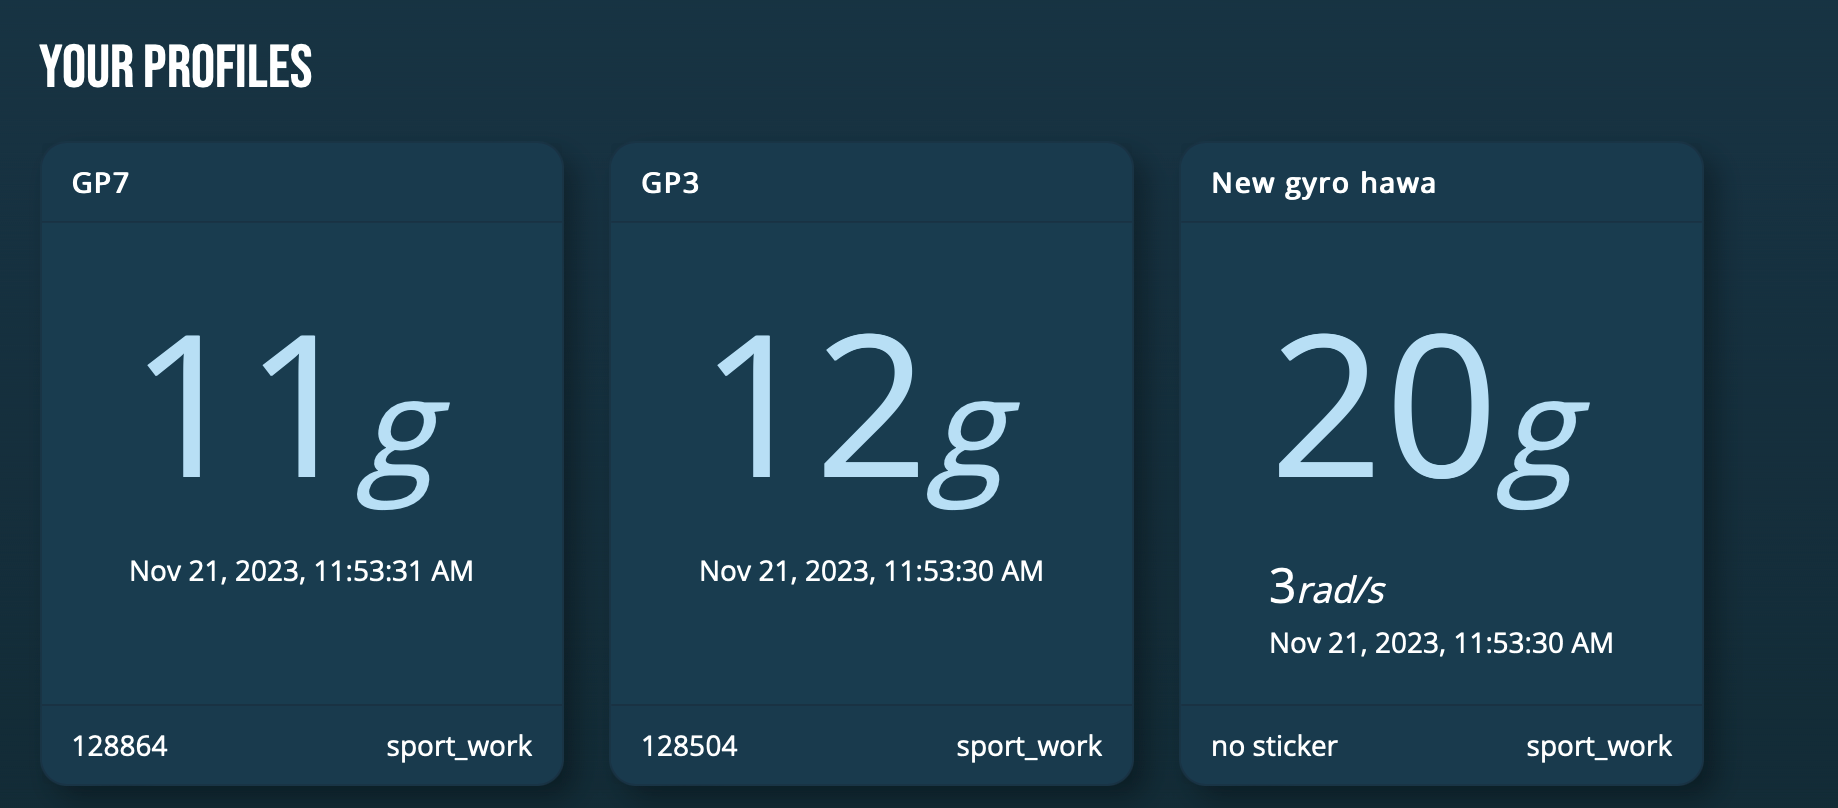
4A. scroll to the top of Team page and click “Back to dashboard” on the left upper corner.

4B. On the Dashboard landing page please scroll down to Your Profiles. Profiles are in dynamic order, profile with latest recorded event featuring on top on the left-hand side. Click on the athlete’s Profile box you wish to see in more detail.
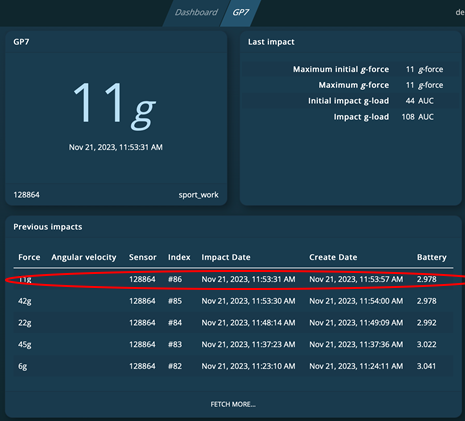
Event history
The latest event on the profile is featuring on the top left-hand corner box.
On the top right-hand corner are featuring the last event’s detailed data.
Below is “Previous impacts”, which is the Profile’s event history. Events in it are in descending order. You can see more events by clicking “fetch more” on the bottom of the history listing.
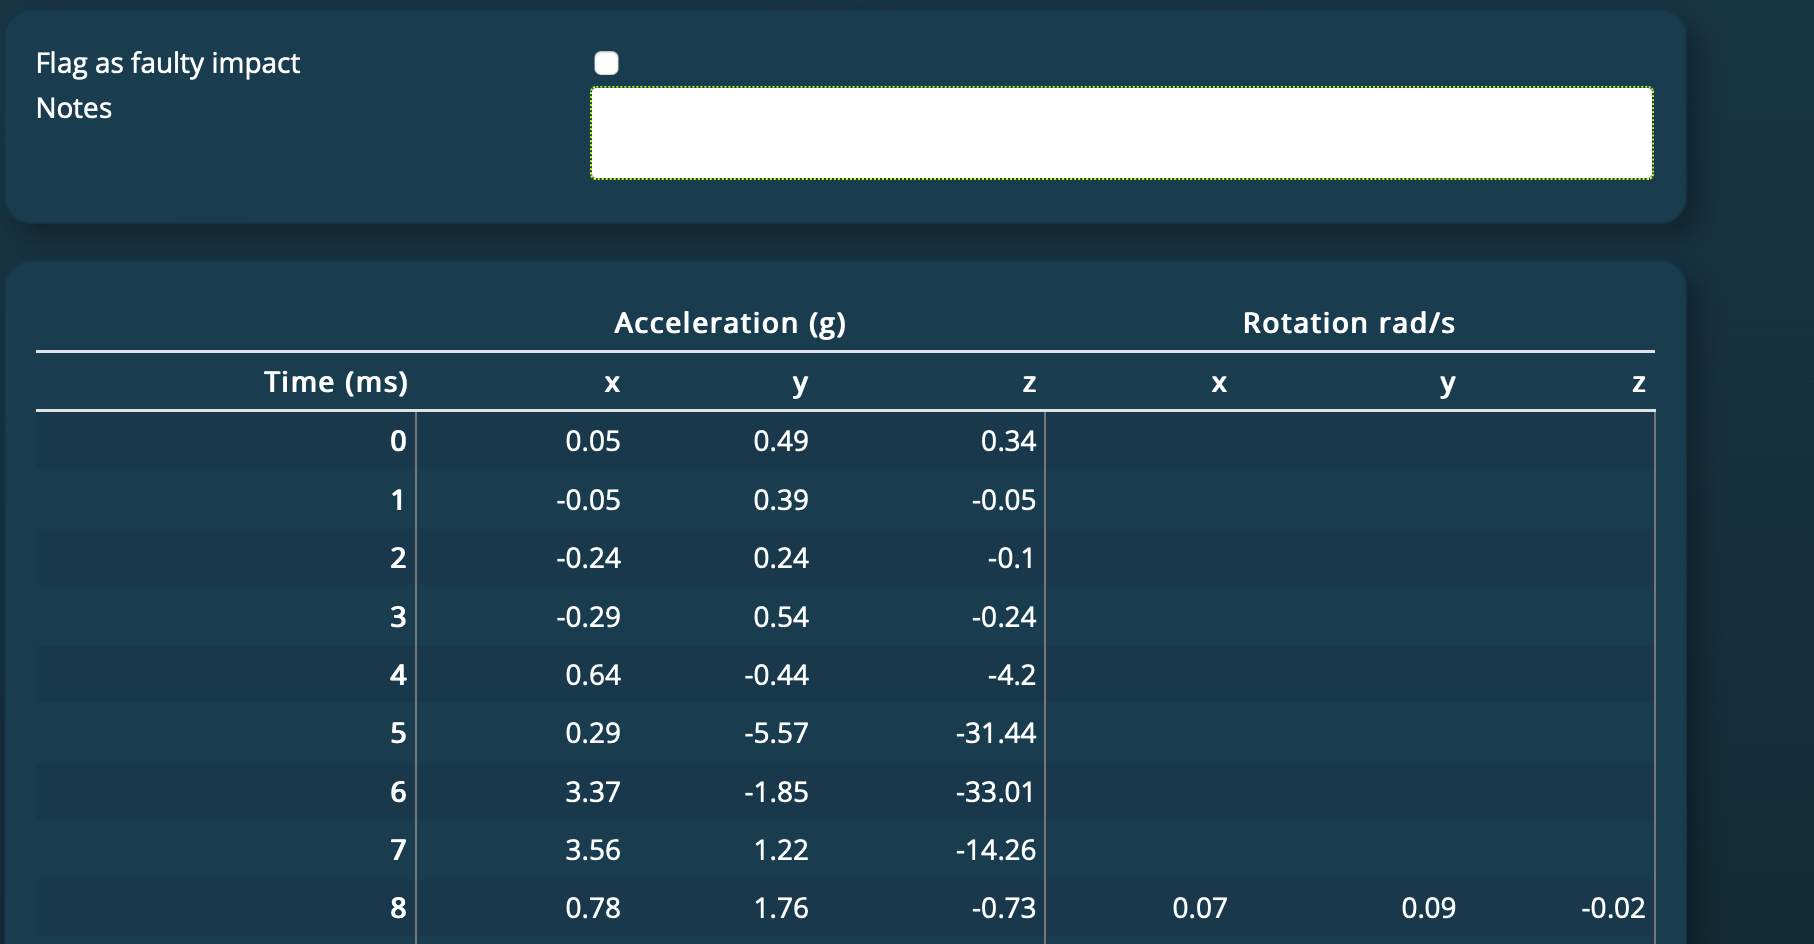
Individual events
Click on any individual event in the history listing to see all the information collected and data derived from each of the events..
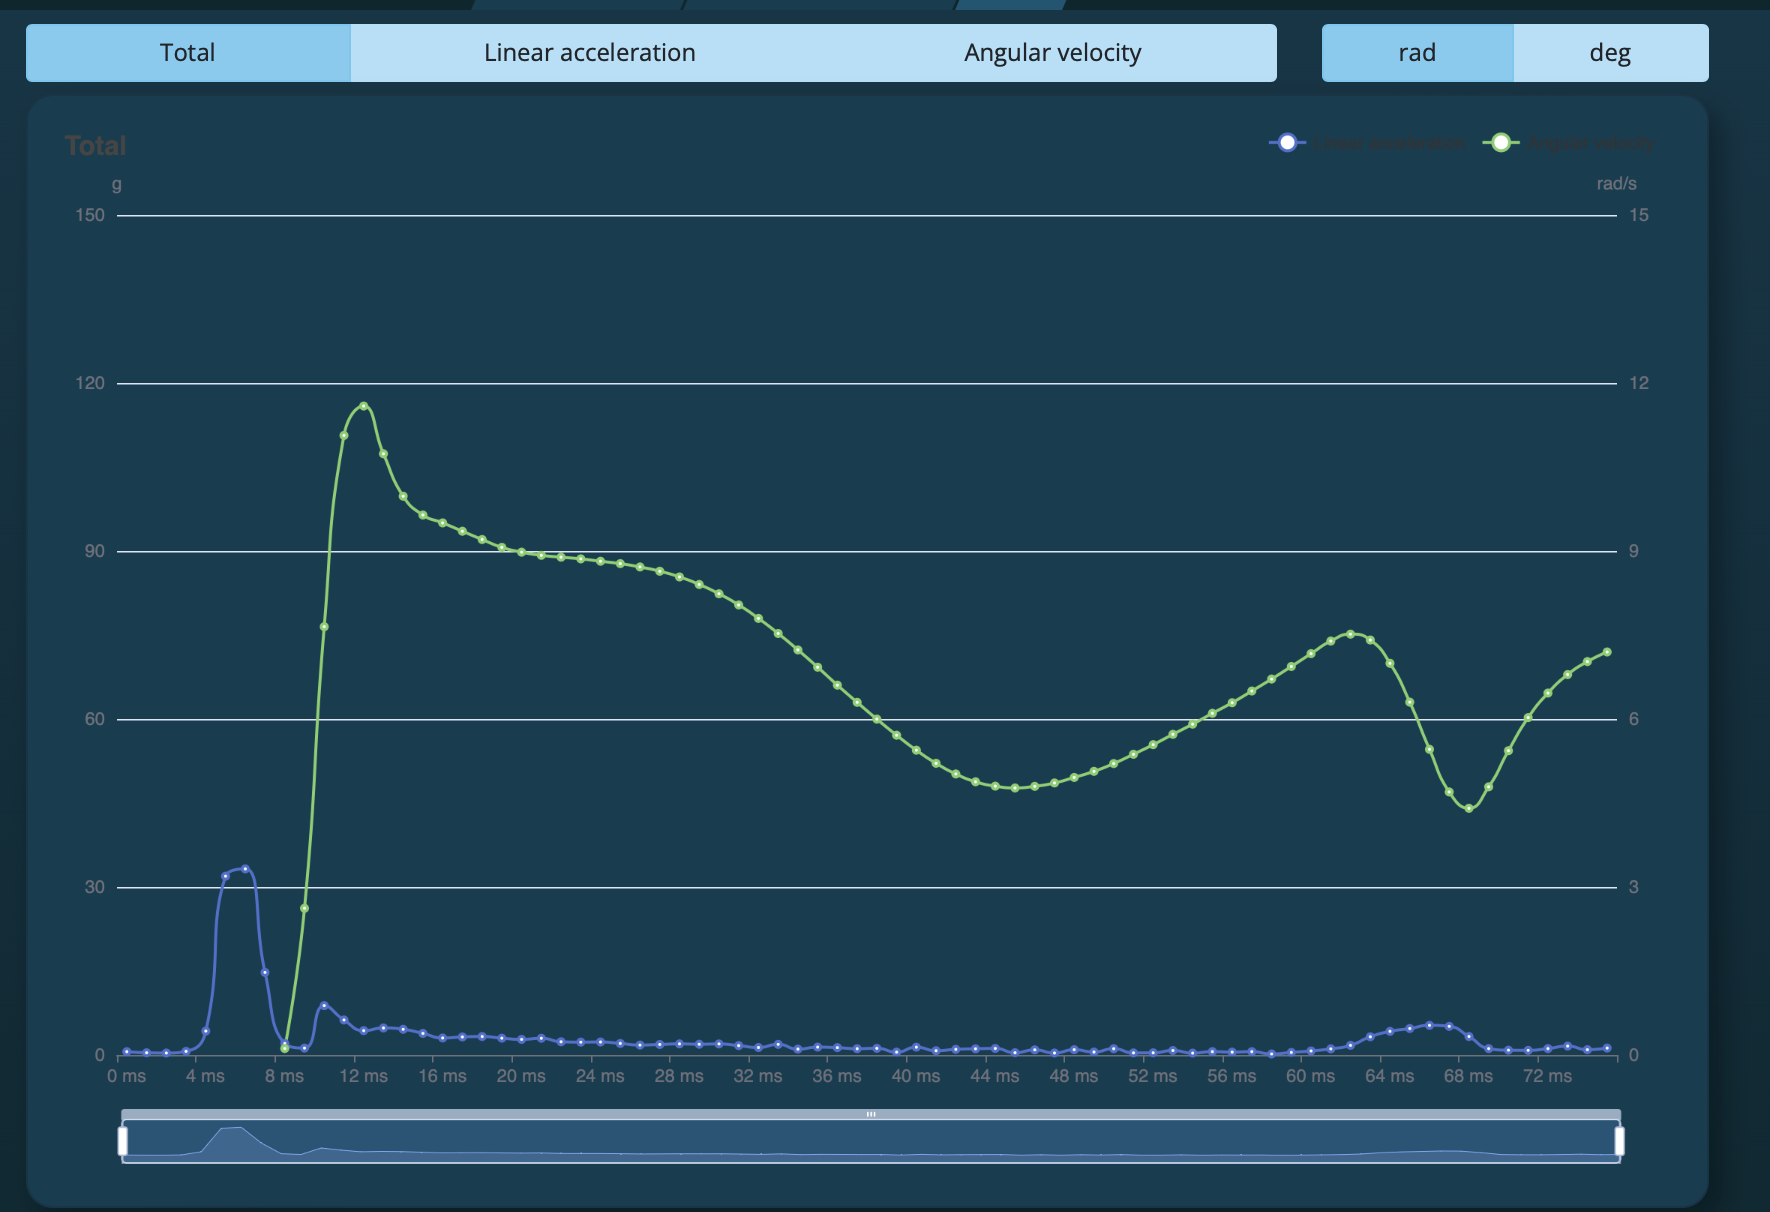
Choose what you want to see in the graphics by clicking on “Total”, “Linear Acceleration” or “Angular velocity” (when applicable) on top of the Individual event page. You can also view data as “rad” or in “deg”.
![]()
You can also mark individual event as “Faulty”, add notes to it, or get measurement point specific data on the event here.
THIS IS BETA1 VERSION. IT IS NOT COMPLETE, ERROR FREE NOR FULLY FUNCTIONAL.
We are working hard to fix bugs and mistakes currently featuring in this Team Dashboard Beta1 version so that all our users could test use it to the full. You can help us by sending us your findings and ideas for improvement either via contact formula in www.act-tracker.com website, or by sending us email to contact(at)norspo.com.
Schedule a session for later start (i.e. not using Quick start)
Go to Team’s page and click “Manage” on the top right-hand corner.
Scroll down “Manage team” page to “Your seasons”. Click on the season you wish add session to.
Scroll down “Manage season” page to “Your sessions”. Click “Add new session”.
Create new session for the future by filling in the blanks. To create the session, click “create a session”.
IMPORTANT USAGE INFORMATION!
– Team Dashboard currently only works “from here on”, which means you cannot import past sessions or events, or data from past sessions or events to Team Dashboard.
– Only data from the sessions added and started in Team Dashboard will be included in Team Dashboard statistics and analytics!
– No data outside the sessions added and started in Team Dashboard will be included in Team Dashboard statistics or analytics!
However, no event data will be lost, even if you have not added and started session in Team Dashboard. All the events recorded by the head sensors and forward to the Cloud will be included and featuring in the App and in Web User Interface just like they have always been.